Observability on a startup budget with Google Cloud
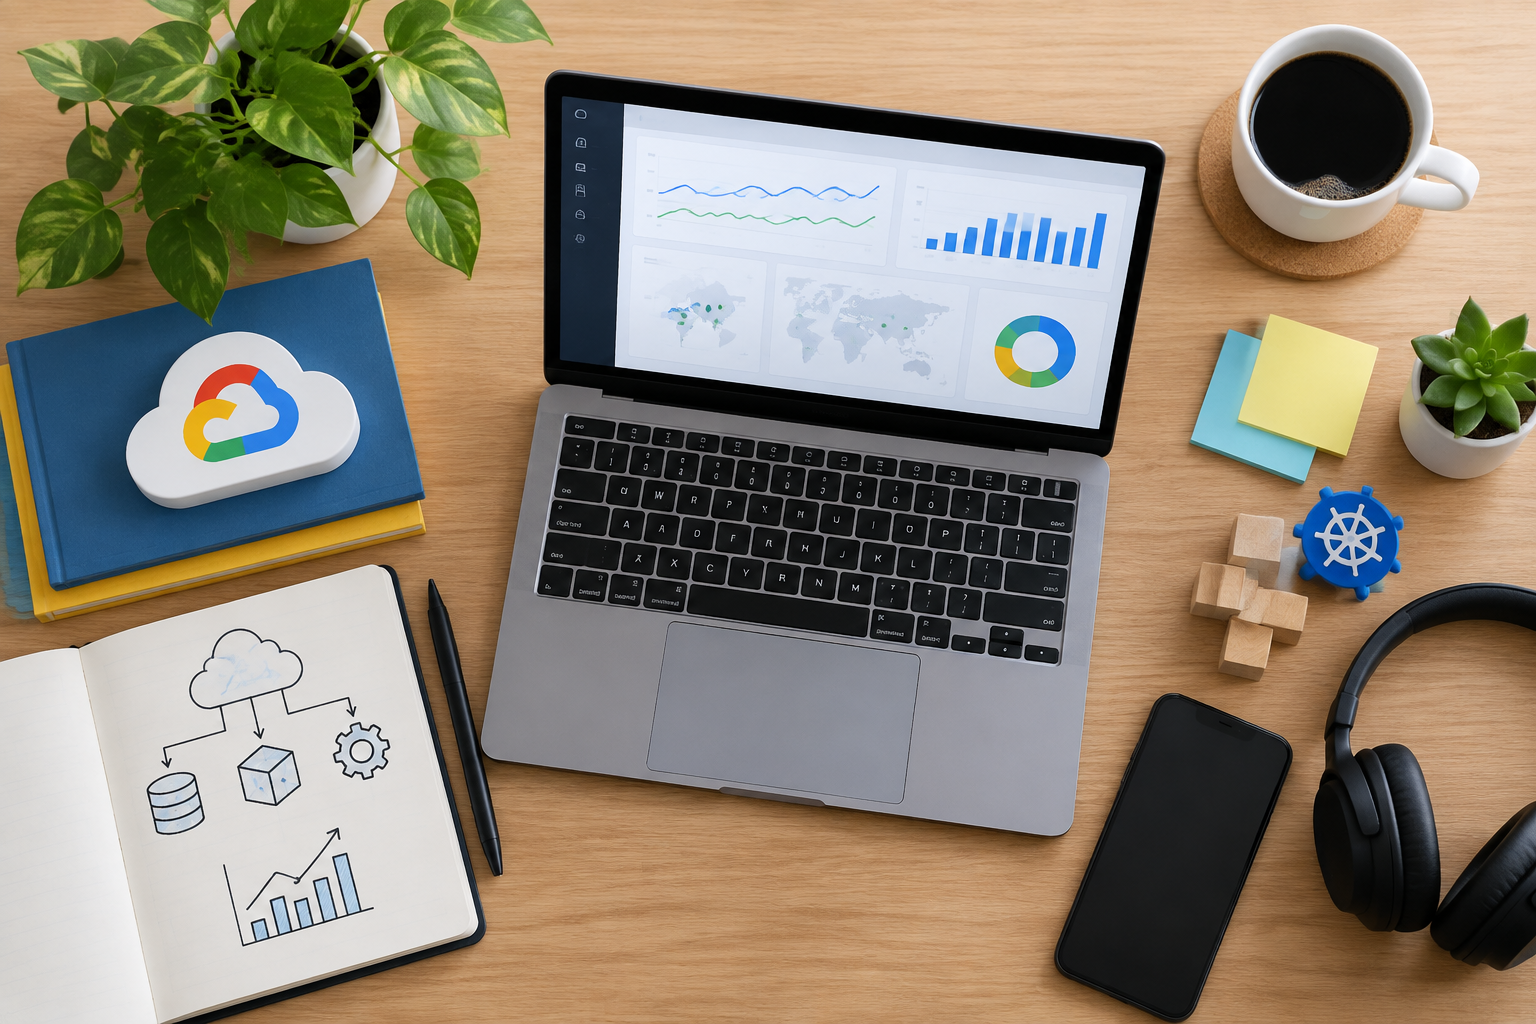
Observability on a startup budget with Google Cloud
By Marco Lopes · May 13, 2024 · Cloud & DevOps
At Kordspace, we work remotely across software, AI, Web3, hardware, and design. Google Cloud is our preferred cloud platform, though we also work with AWS and Azure. Across those environments, we face the same operational question: how do we understand production without creating another expensive system to maintain?
For a startup, observability should help us answer three questions quickly: is the product working, what changed, and where should we investigate? Collecting everything is not the same as answering those questions.
We prefer a small, deliberate setup that grows with the product. On Google Cloud, that usually means starting with Cloud Logging, Cloud Monitoring, Error Reporting, and selective distributed tracing. We add infrastructure only when a concrete debugging or reliability need justifies it.
Start with the journey, not the dashboard
Before installing an agent, we identify the user journeys that matter. For an early SaaS product, those might be signing in, opening a workspace, and saving a document. For an AI application, a successful request might require both an acceptable response time and a usable model result.
We then map each journey to its dependencies: application services, databases, queues, external APIs, and background workers. This gives us a compact service map and a starting point for ownership.
Our initial questions are practical:
- Can users complete the critical action?
- How long does it take, especially for slower requests?
- Are failures increasing?
- Is work accumulating faster than we can process it?
CPU utilization can help explain a problem, but it rarely tells us whether a customer successfully saved their work. We begin with outcomes and use infrastructure signals to investigate causes.
Use the platform before adding a platform
Managed services already provide useful telemetry. Cloud Run exposes request and container metrics, while supported output written to standard output and standard error reaches Cloud Logging. We inspect those signals before building custom collection pipelines.
For Compute Engine, we generally use the Ops Agent when we need guest-level metrics and application logs. We configure only the receivers we need rather than ingesting every available file.
For GKE, we review the enabled logging and monitoring components before adding collectors. Managed Service for Prometheus can make sense when our workloads already expose Prometheus metrics, but managed collection does not make unlimited metric volume free.
Our default is to avoid running a separate logging database, metrics database, and dashboard service for a small application. Self-hosting may reduce a particular vendor bill, but it introduces upgrades, storage management, backups, and another failure domain. We count engineering time as part of the budget.
Make logs structured and intentional
Plain-text logs are easy to start and hard to interrogate consistently. We prefer one structured JSON event per meaningful occurrence, with stable field names across services.
For example, an application event might look like this:
{
  "severity": "ERROR",
  "message": "Document save failed",
  "service": "workspace-api",
  "environment": "production",
  "release": "git-abc123",
  "operation": "document.save",
  "request_id": "req-example",
  "error_code": "DATABASE_TIMEOUT",
  "duration_ms": 1240
}
We keep the message readable while placing searchable details in fields. We also record the deployed revision so that failures can be compared with releases.
Request identifiers are useful log fields, but they should not become metric labels. For trace correlation, we use the supported Cloud Logging trace fields or a logging integration that populates them correctly; an arbitrary trace_id field alone does not provide every console integration.
We never log access tokens, credentials, or complete request bodies by default. AI prompts, uploaded documents, and wallet-related data deserve particular care. We remove sensitive content before it enters the logging pipeline, not merely from a dashboard view.
Treat log volume as a product decision
The fastest way to make logging expensive is to record routine success at excessive detail. Health probes, repeated polling, and verbose dependency output can overwhelm genuinely useful events.
We start by adjusting application log levels. Production debug logging stays off unless we enable it for a specific investigation with an explicit expiry. Where platform request logs already capture an access record, we avoid emitting an identical application access log.
Next, we review log routing and bucket retention. We keep operational logs for a period that matches our actual investigation needs, with separate handling for records that have security or compliance requirements. We do not casually disable audit coverage to save money.
Log Router exclusions can prevent matching entries from being stored in a selected destination. We test filters carefully and review every sink: excluding a log from one destination does not mean another destination stops receiving it. A routed copy in BigQuery or Cloud Storage also introduces its own storage and processing considerations.
Keep metrics small and meaningful
Our first dashboard usually contains request volume, error ratio, latency percentiles, and a small number of saturation indicators. For asynchronous work, we add queue age, backlog, and processing failures.
We distinguish user-visible errors from expected rejections. An invalid password should not automatically count like a database outage. Equally, an HTTP success response should not conceal a failed business operation.
Custom metrics are useful when they describe something platform metrics cannot: a completed checkout, a failed device command, or an exhausted AI request budget. We define those events carefully and avoid turning every log field into a dimension.
Cardinality is the main trap. Labels such as user ID, request ID, wallet address, or raw URL can create large numbers of time series. We use bounded categories such as service, environment, operation, and status class. For routes, we prefer /documents/:id over individual document paths.
We also question collection frequency. Not every signal needs second-by-second resolution to support an actionable decision.
Trace selectively, with a question in mind
Distributed tracing becomes valuable when a request crosses several services or spends time in external dependencies. We use it to distinguish application work from database waits, queue delays, and third-party calls.
OpenTelemetry gives us a useful instrumentation foundation without tying every application-level decision to one backend. We can export supported telemetry to Google Cloud while retaining more flexibility for workloads on AWS or Azure. We still check exporter support and configuration rather than assuming identical behavior everywhere.
We begin with incoming requests and important outbound calls. We propagate trace context across service boundaries and, where feasible, through asynchronous messages.
Sampling keeps overhead and ingestion manageable. We choose a rate based on traffic and investigation needs, then revisit it as usage changes. With head-based sampling, a decision happens before the final outcome is known, so we cannot assume every error will have a trace. Error logs remain important. More sophisticated sampling requires additional pipeline design and is not automatically a startup requirement.
Alert on consequences, not every fluctuation
An alert should interrupt us only when someone can take a useful action. A brief CPU spike usually belongs on a graph, not in an overnight notification.
We define a simple service-level indicator for each critical journey, such as the proportion of valid save attempts that succeed. We then choose a service-level objective that reflects product expectations and our operating capacity, rather than copying an impressive-looking target.
When traffic supports it, error-budget burn-rate alerts help identify failures that threaten the objective. We can combine a fast window for severe incidents with a slower window for sustained degradation. At low volume, we account for small denominators and supplement request-based signals with uptime checks.
Every alert gets an owner, a notification route, and a short runbook. The runbook states what the signal means, where to look first, and which mitigation is safe. We test notification delivery before relying on it.
Give a remote team a shared investigation path
Observability needs to work when teammates are in different locations and the original author is offline. We maintain one overview dashboard per production system rather than a collection of personal dashboards that only their creators understand.
Our investigation path is consistent: check user impact, inspect recent deployments, identify the affected service, open relevant logs, and follow traces where available. We include saved queries and links in runbooks to reduce navigation during incidents.
Error Reporting can help group supported application exceptions, provided we emit recognized error records and stack traces. We treat it as a triage aid, not a replacement for service-level monitoring.
We manage alert policies and dashboards as code where practical. Access follows least privilege, particularly when logs may expose customer metadata. After an incident, we improve a missing signal or confusing runbook rather than automatically adding more alerts.
Put observability spending on its own dashboard
We review current Google Cloud pricing for each telemetry type before setting a budget. Logging, metrics, tracing, retention, and exported data do not all share the same billing model. We avoid assuming that a free allowance makes every associated feature free.
Cloud Billing budgets and notifications provide useful warnings, but they are not spending caps. We pair them with regular usage reviews and investigate growth by service, environment, and telemetry source.
When costs rise, we look for a changed behavior: a debug flag left on, a new high-cardinality label, duplicated collection, or a noisy retry loop. Reducing unnecessary generation is usually better than hiding the resulting bill with a broad exclusion.
We also keep development and production distinguishable. Non-production environments rarely need the same retention, collection frequency, or notification policy as customer-facing workloads.
Our minimum viable observability checklist
Before we consider an initial setup ready, we check that:
- Critical user journeys have success and latency signals.
- Production logs are structured and scrubbed of sensitive data.
- Release identifiers and request correlation are available.
- Metric labels have bounded cardinality.
- Log routing, retention, and trace sampling are deliberate.
- Alerts reach an owner and link to a tested runbook.
- Billing notifications and telemetry usage reviews are in place.
We do not need a perfect observability platform to launch. We need enough trustworthy evidence to detect user impact, investigate quickly, and improve without creating an uncontrolled operating cost. At Kordspace, we build that foundation alongside the product. To work with us on a practical Google Cloud setup, start a project, or explore our related services to see how we approach software delivery and cloud operations.
Conversation (0)
No comments yet. Start the conversation.
Join the conversation
Create a free member account to comment.